Insights Blog
New Management Pack for Microsoft SQL Server. Datacenter View.
In the previous two blog posts we have discussed the installation procedures (link) and performance improvements (LINK) in the new version of MS SQL Management Pack (MP). The Datacenter View, the Dashboards home page, provides information about the datacenter health state in an aggregated way. The Datacenter View is fully customizable; it is possible to…
Share:
Categories:
Featured Posts:
-

The Future of Cloud Cost Management: Effective Strategies for Managing and Optimizing Cloud Costs
Read more: The Future of Cloud Cost Management: Effective Strategies for Managing and Optimizing Cloud Costs -

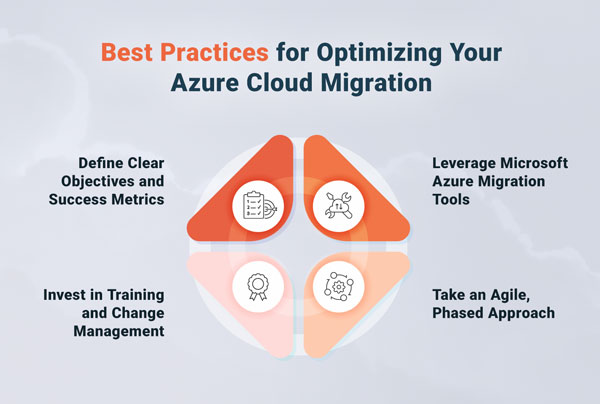
Cloud Migration Strategy: How to Optimize Your Move to Azure
Read more: Cloud Migration Strategy: How to Optimize Your Move to Azure -

Mastering Cloud Governance: Top Strategies for Azure Security, Compliance and Innovation
Read more: Mastering Cloud Governance: Top Strategies for Azure Security, Compliance and Innovation -

How to Boost your Security Outcomes with Microsoft Copilot for Security
Read more: How to Boost your Security Outcomes with Microsoft Copilot for Security -

Ensuring Business Continuity with Azure Disaster Recovery: A Comprehensive Guide for Enterprises
Read more: Ensuring Business Continuity with Azure Disaster Recovery: A Comprehensive Guide for Enterprises -

The Art of Right-Sizing: Tailoring Azure Resources to Your Enterprise’s Needs
Read more: The Art of Right-Sizing: Tailoring Azure Resources to Your Enterprise’s Needs
Solutions
Cost Management & Optimization
Security
Operations
Migration
App Modernization
Azure Services
CSP
Azure Migration Services
Azure Security
Business Continuity/Disaster Recovery
Virtual Cloud Center of Excellence
App & Data
Application Development
Modernization
DevOps
Data and ML
Artificial Intellegence
Free Offers
Azure Health Check
Azure Optimization Assessment
Free Azure Migration
Free Security Workshop
