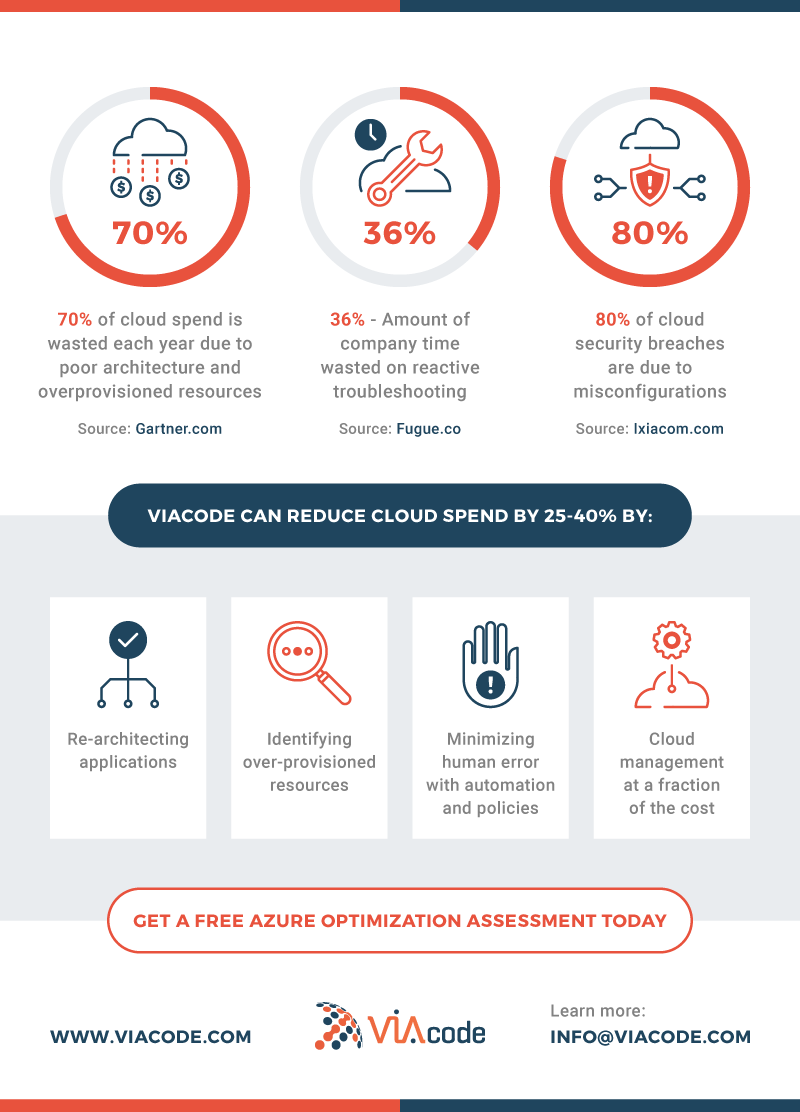
Many people ask us, “How do you deliver 30% cost savings on average?” We created an infographic to show in numbers how we accomplish it.
The questions we ask:
- Does your Azure spend stay within budget? Gartner reports that 70% of cloud spend is wasted each year due to poor architecture and overprovisioned resources.
- How much time does your team spend troubleshooting? Fugue.co found that 36% of company time is spent on reactive troubleshooting.
- Are your configurations putting your company at risk? Ixia.com found that 80% of security breaches are due to misconfigurations.
Do you fit into any of the categories in the infographic below?
Take a 30-second, no cost
Azure health check.
 How can we help your team optimize spend, manage resources, create policies and assist with your managing your cloud?
You can get an Azure Assessment that will answer those questions for you. And the best part is there is no cost for you!
Get a free Azure health check now. How can we help your team optimize spend, manage resources, create policies and assist with your managing your cloud?
You can get an Azure Assessment that will answer those questions for you. And the best part is there is no cost for you!
Get a free Azure health check now.


